Background >
Feature Generation
The primary data analyzed on this site is Bitcoin's closing price. However, we recognize that various factors, also known as features, influence its price and can enhance the model's prediction accuracy.
Features to Add
Seasonality
Bitcoin undergoes regular halving events when the rate of new Bitcoin creation is halved. This mechanism is designed to control inflation, thus it's reasonable to expect that it influences Bitcoin prices.
The year is a valuable feature for this reason. However, instead of using all four digits in the year, we capture periodicity by using just the last digit, e.g., '4' in 2024. This approach helps prevent data leakage or overfitting as a model with access to full digits might memorize past events instead of learning the underlying pattern.
Likewise, day of week, month, etc. can be used as features.
Ratios
Price data typically includes OHLC (Open, High, Low, Close) values. By calculating ratios between them, we can measure price fluctuation. For example, $(Open - Close) / Close$ represents the percentage change between open and close prices. Ratios can be computed across various data fields.
Lagged Values
Lagged values are particularly useful as features when the model is not designed to handle time series data. For instance, Linear Tree processes each row in the tabular data independently, without considering previous rows. To assist the model, fields such as the closing price from the previous day, 7 days ago, etc., can be added. By incorporating lagged values after generating other features, such as OHLC ratios, we ensure that all previous features are also available as lagged value columns.
On the other hand, models that can work with time series data such as ETS and ARIMA won't need these.
Comparison with Previous Values
Instead of using today's price as a raw value, we can represent it as a ratio relative to the previous price, e.g., 1.5% increase from the previous day. Using ratio makes prediction over trending values easier. For example, a model that never observed 100,000 USD bitcoin price during the training can still make a good prediction on how much it will increase as long as increase rate doesn't drastically change.
Log transformation and differences used in making data stationary are implicitly doing this already as $log(x_1) - log(x_2)$ is $log(\frac{x1}{x_2})$. Such is a ratio although it's in log scale.
Technical Indicators
Technical indicators are derived from price and volume data, such as moving averages, relative strength index (RSI), Bollinger Bands, MACD, and stochastic oscillator.
The goal of these indicators is to predict future price movements, although none alone is conclusive. They are often used as signals within a broader prediction model.
Known Patterns
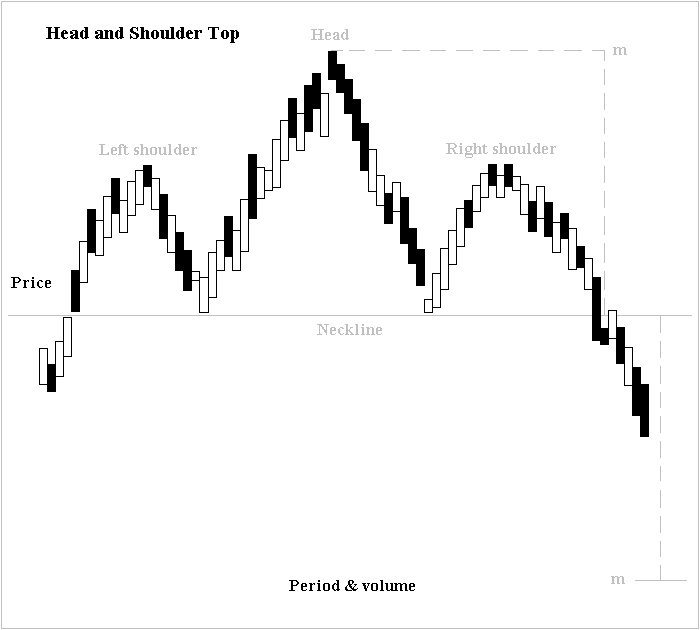
Technical analysis often incorporates specific patterns. For example, the head and shoulders pattern, shown below, suggests a price drop after reaching a peak.

Source: image by Altafqadir, shared
under Creative Commons Attribution 3.0
Unported
Identifying patterns like head and shoulders can be subjective. Some patterns, however, are easier to recognize. For instance, a candlestick with a closing price higher than its opening indicates a price increase for the day. Some traders focus on the wick—the difference between the opening and lowest prices, or between the closing and highest prices—as it reflects buying or selling pressure.
Two candlesticks with (closing price) > (opening price), showing different wick types
Deep Learning
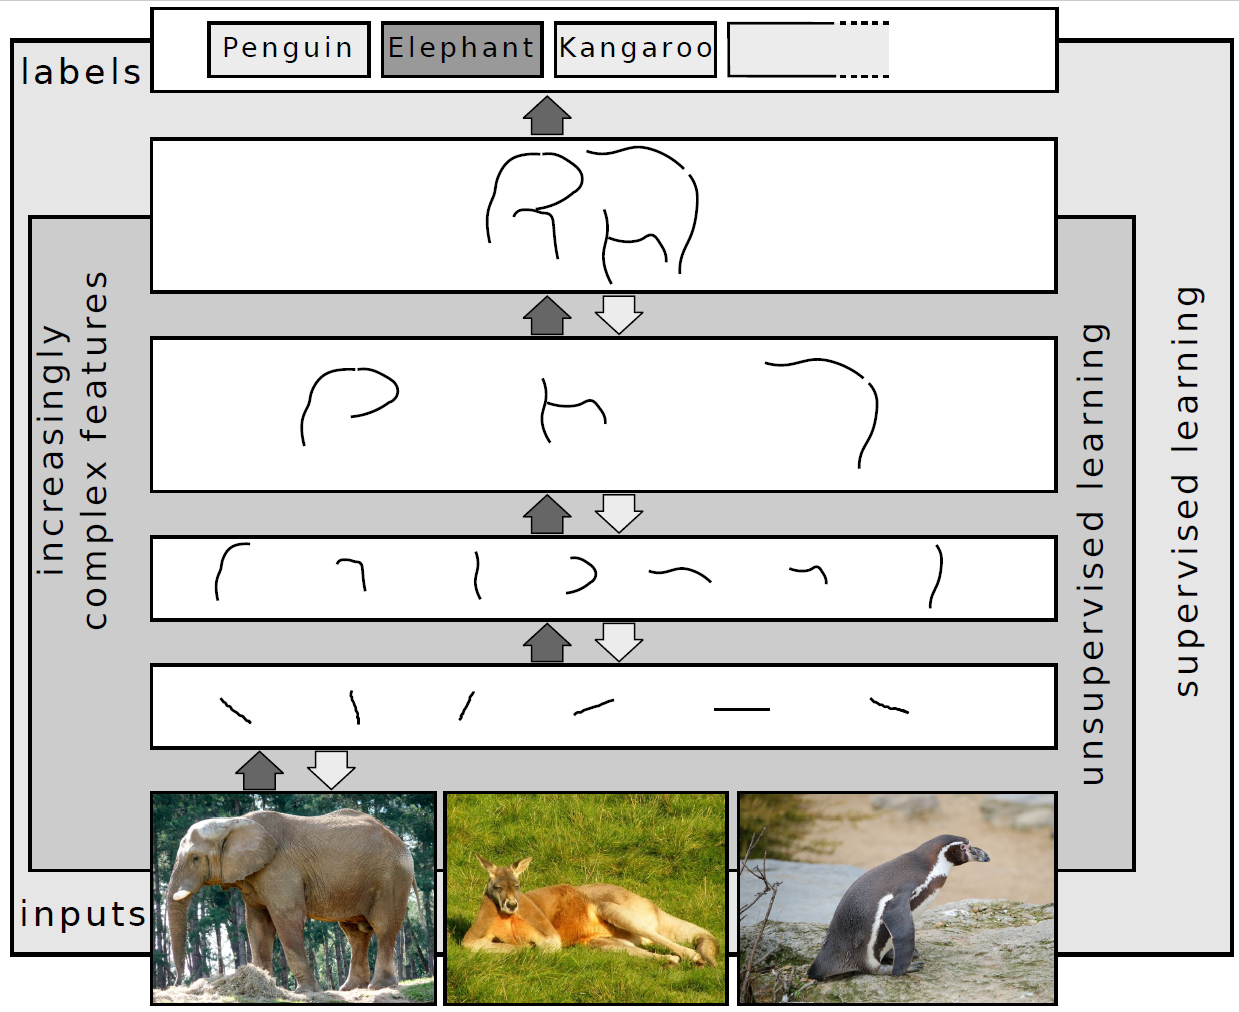
Deep learning not only improves data fitting but also enables automatic feature extraction. For example, in image classification, the lower layers detect basic features like edges, while upper layers recognize more complex patterns like shapes and objects.
By training a model with sufficient complexity, we expect the deep learning to identify and extract features along the way of price prediction.

Image by Sven Behnke, CC BY-SA 4.0
However, deep learning being able to find features automatically doesn't mean that we can't add features manually. We still can provide features to help the model.
Programmatic Feature Generation
Features can also be generated programmatically by combining existing ones heuristically. For instance, we could create features such as feature 1 * feature 2, feature 1 + feature 2, feature 1 / feature 2, etc. Then they're evaluated by how much they contribute to the model performance.
When to Generate Features
A key decision is whether to generate features before or after the data split. We recommend generating features BEFORE the data split and hyper parameter optimization. This approach simplifies the addition of lagged values and technical indicators that depend on the past, such as the 200-day SMA (Simple Moving Average).
Feature generation before data split does not cause data leakage as long as the generated features are based solely on past values. During testing, we always have access to the whole past data, so this is not an issue.
See also feature transformation and data scaling.