Model Understanding >
Decision Tree
Decision tree is a widely-used machine learning algorithm for both classification and regression tasks. Unlike time series models, such as ARIMA, decision trees do not assume any specific patterns in the data.
Intuitive and Interpretable
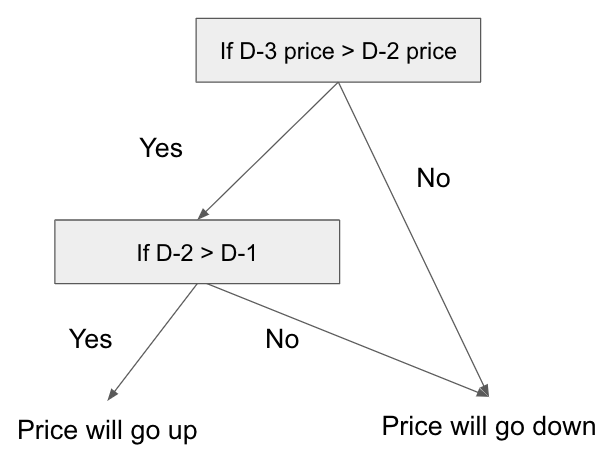
Decision trees are intuitive and easy to interpret models. They work by splitting the data into subsets based on feature values and making predictions based on the subset to which the data belongs. For example, consider a scenario where the price of Bitcoin increases only if it went up both the day before yesterday and yesterday. The decision tree for this scenario might look like the following:
Handles multiple features effectively
Each non leaf node in a decision tree can handle either categorical or continuous features, e.g., if x = "A", then go to left child node, otherwise go to right child node. Since each non leaf node's decision is after the parent node's, it's essentially a tree of complex if-else statements.
Thanks to such capability, exogenous data such as the NASDAQ-100 index can be seamlessly incorporated into the tree. Also, missing values (e.g., NaN or None) in features can be treated as a category of its own and used as node split criteria. In contrast, methods like ARIMA, which require non-missing values, fails with NaN or None.
Effectiveness
Despite the advancements in deep learning algorithms, decision trees and their ensemble methods often perform surprisingly well. For example, see this discussion on why tree-based models still outperform deep learning on typical tabular data.
Limitations
Capturing trends and seasonality
A decision tree assigns a constant value to leaf node, estimated from the training data. Therefore, if a certain high bitcoin price was never observed in the past, it's not possible for the tree to predict it. Also, decision tree is not designed to handle regularly happening events, such as the seasonality.
Above limitations makes the decision tree difficult to use for time series forecasting while ARIMA can handle them fairly well. This issue can be addresse by methods described in capturing trends and feature generation.
Overfitting
Decision trees are prone to overfitting, especially when the tree is deep. This can be mitigated by using ensemble methods such as random forests, or gradient boosting, or by limiting the depth of the tree.
Capturing complex regions
Making trees shallow does avoid overfitting, but it introduces the problem of rectangular splits. For instance, a node that splits on ((x > 100) and (y < 50))divides a region by drawing vertical and horizontal lines, and it cannot capture more complex regions like x^2 < y.
Decision tree for Air Passengers
To demonstrate model performance, we show the model's prediction results for the air passengers dataset. The cross validation process identified the best transformation to make the time series stationary and the optimal hyperparameters. The Root Mean Squared Error on the next day's closing price was used to determine the best model.
In the chart, we display the model's predictions for last split of cross validation and test data.
- train: Training data of the last split.
- validation: Validation data of the last split.
- prediction (train, validation): Prdiction for train and validation data period. For each row (or a sliding window) of data, predictions are made for n days into the future (where n is set to 1, 2, 7). The predictions are then combined into a single series of dots. Since the accuracy of predictions decreases for large n, we see some hiccups in the predictions. The predictions from the tail of the train spills into the validation period as that's future from the 'train' data period viewpoint. These are somewhat peculiar settings, but it works well in testing if the model's predictions are good enough.
- test(input): Test input data.
- test(actual): Test actual data.
- prediction(test): The model's prediction given the test input. There's only one prediction from the last row (or the last sliding window) of the test input which corresponds to 1, 2, 7 days later after 'test(input)'.
Decision tree model predicts the increases percentage of air passengers as described in capturing trends.