Feature Generation
The primary data we analyze on this site is Bitcoin's closing price. However, we acknowledge that various factors, also known as features, influence its price and can enhance our model's prediction accuracy.
Ratios
In the price data, there usually are OHLC (Open, High, Low, Close). By taking ratios between them, we can create new features. For example, $(Open - Close) / Close$ is the percentage change between open and close prices. Such ratios can be added across various fields in the data.
Previous values
We can also add previous values as features. For example, closing price of the previous day, or the average price of the previous 7 days.
Comparison with Preceding Rows
While we can use today's price as a raw value, such as 300 USD, we can also express it as a ratio relative to a previous price, such as a 1.02% increase from yesterday.
Many machine learning and AI models require normalized data, i.e., values within certain range like $0 <= value <= 1$, and the ratios are particularly useful for this purpose. This requirement is similar to the process of making time series data stationary, which often involves differencing.
The reason why differencing is related is that the data transformation often involves taking the logarithm of the values. In such case, difference, i.e., $log(x_1) - log(x_2)$ will be the same with $log(\frac{x1}{x_2})$, i.e., log of ratio.
The comparison doesn't always need to be with the previous row. It can be with the 7 days ago, 14 days ago, etc.
Technical indicators
Technical indicators are calculated based on price and volume data, such as moving averages and relative strength index (RSI), Bollinger Bands, MACD, and stochastic oscillator.
All of those indicators's goal is to predict fututure price movements. However, none of them alone is sufficient. Oftentimes, they are used as filters to reduce the number of candidates or as a component of the final prediction model.
Relevant market data
We can also add external data to the price data. For example, we can add the NASDAQ index, interest rates, gold price, and many other economic indicators. Some of the large investment companies are said to analyze the metrics that aren't necessarily available to everyone in the market. For example, the number of ships in the port.
Patterns
Many people have been producing various patterns for technical analysis. For exmaple, head and shoulder pattern, shown below, explains the price moving down after a peak.
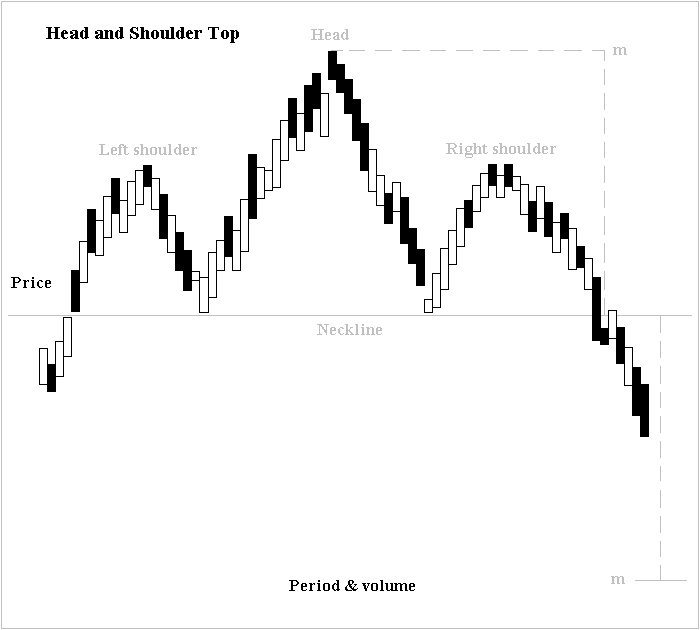
Source: image is created by Altafqadir, shared as Creative Commons Attribution 3.0 Unported
While when it is head and shoulder are hard to judge, Some patterns are easier to identify. For example, let's say there's a candle with a closing price that's higher than the opening. It objectively indicates that the price went up during the day. Some people are interested in its wick, i.e., the difference between the opening and the lowest price OR the difference between the closing and the highest price. They see the wick as the potential buying OR selling pressure.
Two candlesticks with (closing price) > (opening price), but different types of wicks
Deciding what to include as features
Including all possible features is not ideal. Some features may be completely irrelevant but appear to contribute to model performance. Others might be useful only for a short period. Therefore, we employ various strategies to select features.
Model-agnostic
There are mainly two types of feature selection methods. The first type is model-agnostic, which can be applied to any model. For example, we might remove features with little variation, assuming they won't be useful. Another method involves building a simple model, such as a linear model with L1 regularization (also known as Lasso), to identify less important features. Additionally, we can test all possible feature combinations with the given model to select the best subset.
Model-specific
In model-specific methods, we can use the information provided by the model. For example, an algorithm like random forest indicates the importance of each feature in the model's predictions.